Project overview
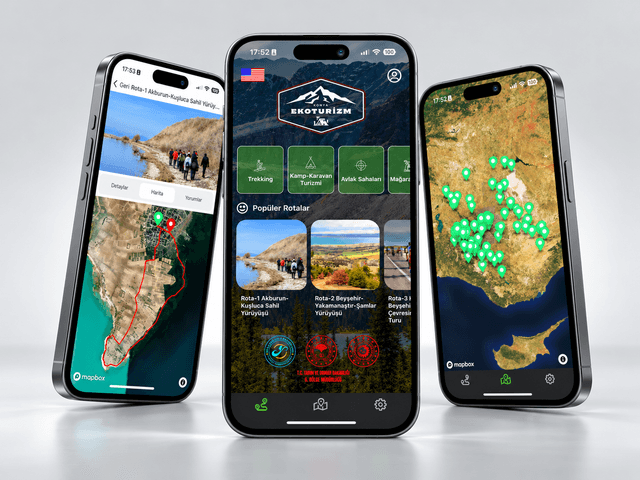
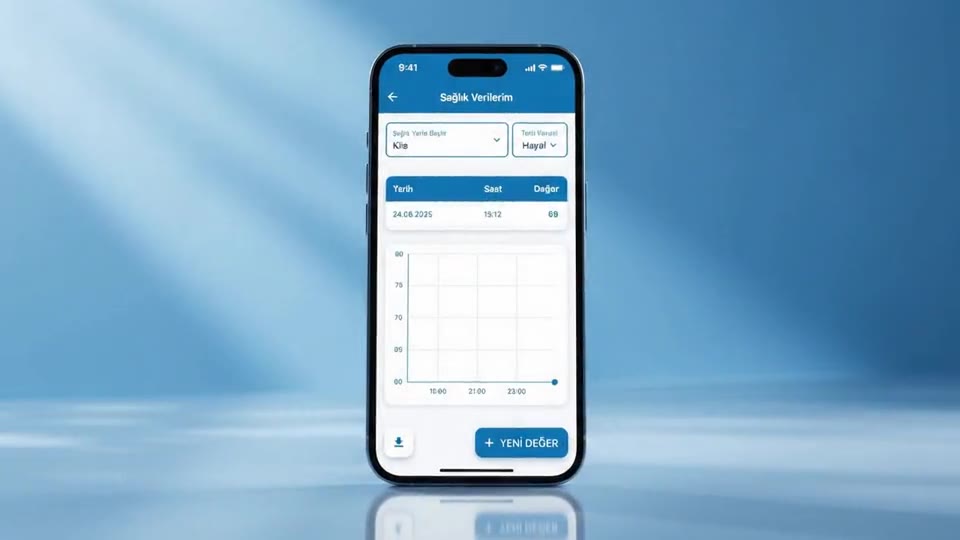
For people living with a chronic condition, being able to read their measurements in a meaningful way matters as much as taking them regularly. Kronik İzlem was developed as a mobile app where patients record their health data and follow how it changes over time through charts.
What we built
- Data entry: simple forms for logging daily health measurements quickly and accurately.
- Chart reporting: legible charts that show how the records develop over time.
- History: an easy way to look back at earlier measurements.
- Reminders: notifications for measurement and medication times, set per person.
- Report sharing: exporting a summary of a chosen period to share with a doctor.
- Data security: encrypted storage of health data and secure session handling.
In a product that handles health data, clarity comes first. We built the interface on large, readable typography and a calm colour palette, and designed the charts so they can be understood without any technical background. Keeping data entry to a few steps was meant to encourage regular use.
How we worked
We began Kronik İzlem with a short discovery: together we pinned down the target user, the main flows and the scope of the first release. We then designed the flows and interface in Figma and tested them with a clickable prototype. Throughout development we shared working builds at regular intervals, and we prepared the app for release after testing it on real devices.
Technical foundation
We built the app for iOS and Android from a single Flutter codebase, using Swift and Kotlin where platform-specific needs arose. On the server side there is an API written in Node.js, with Firebase for push notifications and authentication. Design and prototypes were prepared in Figma.
Outcome
Kronik İzlem became a mobile app that makes it easier for patients to keep track of their own health data and presents that data in a clear visual language.
Technologies used
- Node.js
- Flutter
- Swift
- Kotlin
- Firebase
- Figma